概述
Harbor 的指标主要分成五部分,分为是 Info, Core, General, JobService 和 Registry。
指标
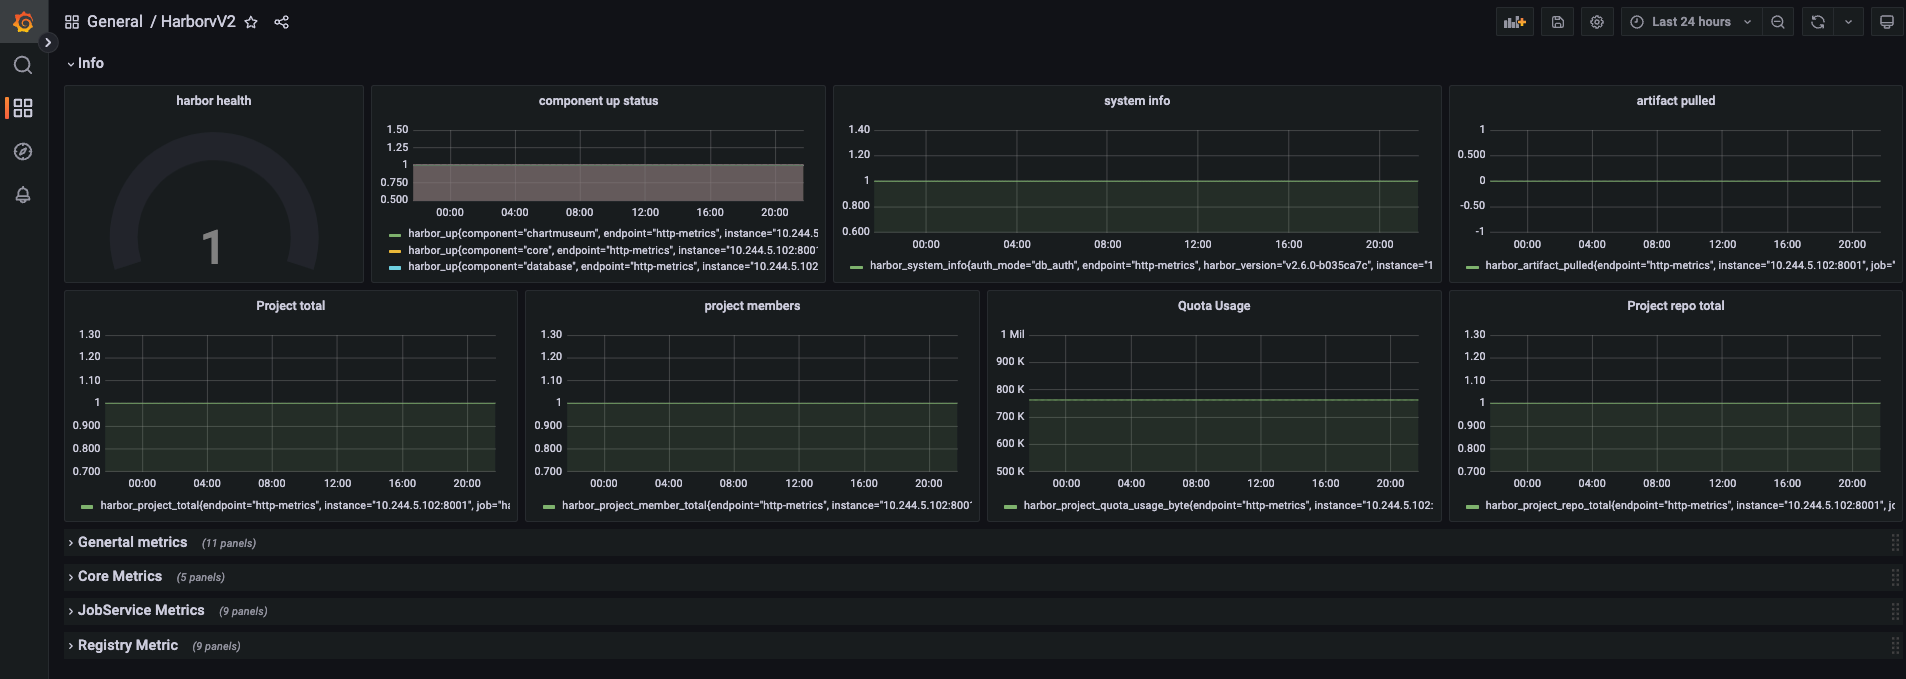
下图是 Harbor 官方给的 Grafana 的 Dashboard,截止目前已经有17个月没有更新过了。

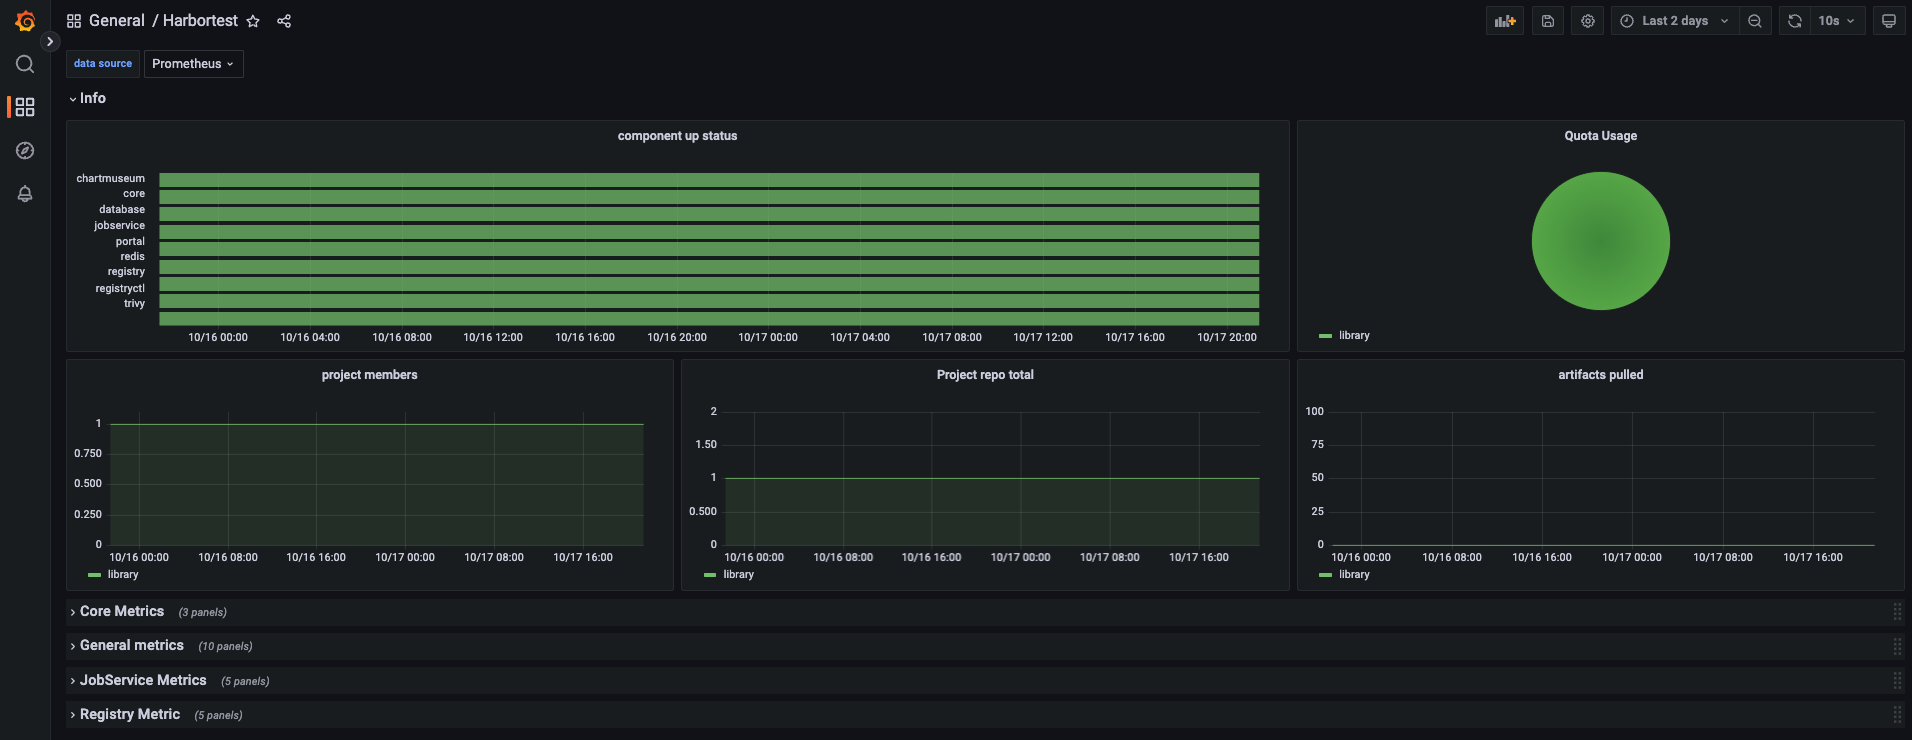
截止本文完成的时间,新的 Dashboard 目前还没有合并到 Master 分支,具体可以查看 Harbor#16661,不过笔者测试过,基本是可以使用的,新的 Dashboard 相对以前的有一些变化,更多的是点变成线了,看起来更清楚一点。
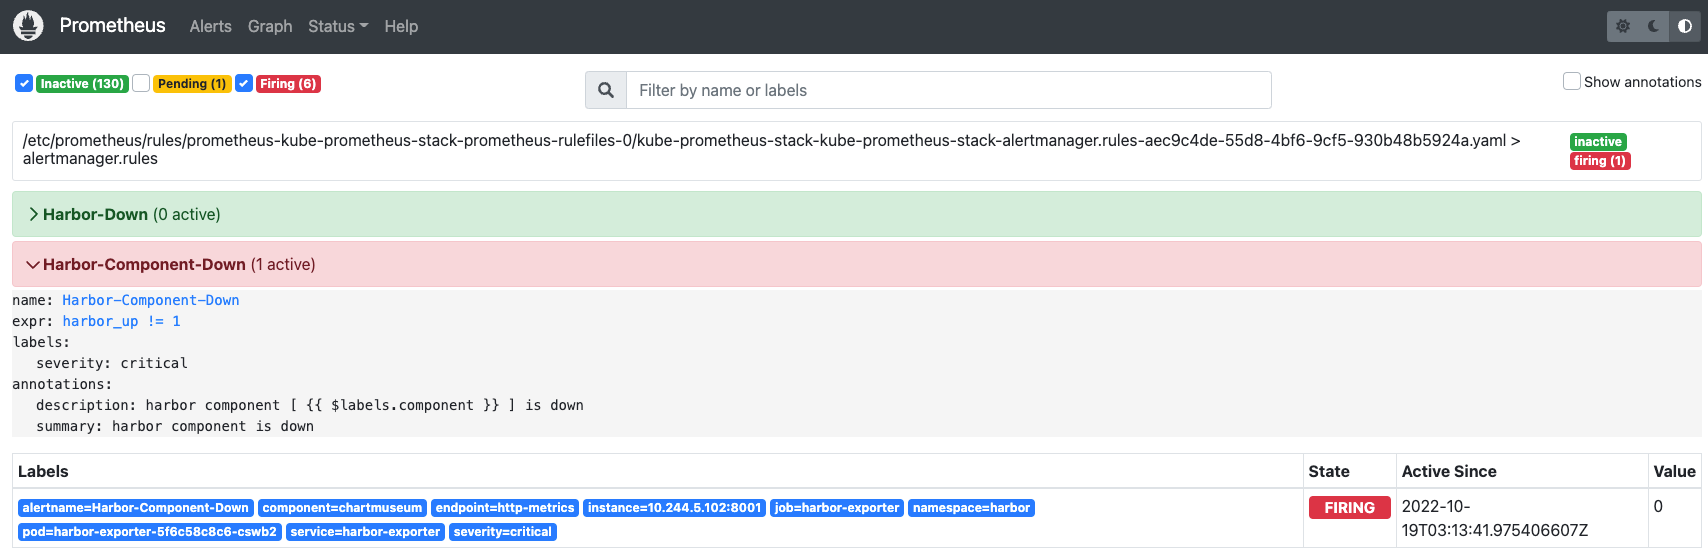
告警
Harbor 官方是没有提供 Prometheus 的 Alert Rule 配置的,但是作为使用了 kube-prometheus-stack 全家桶的用户,还是希望统一一下告警的路径。下面是根据日常运维的经验配置的一些告警的规则,供读者参考。数据库 PostgreSQL 和 Redis 的告警就不在这里提供了。
 1
 2
 3
 4
 5
 6
 7
 8
 9
10
11
12
13
14
15
16
17
18
19
20
21
22
23
24
25
26
27
28
29
30
31
32
33
34
35
36
37
38
39
40
41
42
43
44
45
|
groups:
- name: HarborAlertRules
  rules:
    - alert: HarborDown
      expr: absent(harbor_health) == 1
      labels:
        severity: critical
      annotations:
        summary: "harbor is down"
        description: "harbor is down"
    - alert: HarborComponentDown
      expr: harbor_up != 1
      labels:
        severity: critical
      annotations:
        summary: "harbor component is down"
        description: "harbor component [ {{ $labels.component }} ] is down"
    - alert: HarborProjectQuotaNotSet
      expr: harbor_project_quota_byte == -1
      labels:
        severity: critical
      annotations:
        summary: "harbor prject [ {{ $labels.project_name }} ] quota is not set"
        description: ""
    - alert: HarborProjectQuotaUsageMoreThan80%
      expr: harbor_project_quota_usage_byte / harbor_project_quota_byte * 100 > 80
      labels:
        severity: critical
      annotations:
        summary: "harbor prject quota usage more than 80%"
        description: "harbor prject [ {{ $labels.project_name }} ] quota usage more than 80%"
    - alert: HarborCoreAveragedRequestTimeIn2MinsMoreThan5Seconds
      expr: rate(harbor_core_http_request_duration_seconds_sum[2m])/rate(harbor_core_http_request_duration_seconds_count[2m]) > 5
      labels:
        severity: warn
      annotations:
        summary: "harbor-core averaged request time in 2 mins is more than 5 seconds"
        description: "harbor-core [ {{ $labels.method }} ] averaged request time in 2 mins is more than 5 seconds"
    - alert: HarborRegistryAveragedRequestTimeIn2MinsMoreThan5Seconds
      expr: rate(registry_http_request_duration_seconds_sum[2m]) / rate(registry_http_request_duration_seconds_count[2m]) > 5
      labels:
        severity: warn
      annotations:
        summary: "harbor-registry averaged request time in 2 mins is more than 5 seconds"
        description: "harbor-registry [ {{ $labels.method }} ] averaged request time in 2 mins is more than 5 seconds"
|
参考资料
- Harbor权威指南
- Awesome Prometheus alerts
- Harbor Metrics
警告
本文最后更新于 2022年2月26日,文中内容可能已过时,请谨慎参考。