概述
通过 Helm Charts 部署的 Harbor,其中里面的 PostgreSQL 以及 Redis 通过调整参数,使用外部的高可用数据库,可以为 Harbor 提供更稳定的服务,虽然这些数据库的运维和操作不是我们搭建 Harbor 的重点,但是如果这些组件出问题了,也必须要能够处理,本文就 PostgreSQL 和 Redis 在 Harbor 中的高可用具体分析一下。
PostgreSQL高可用
External PostgreSQL Set the database.type to external and fill the information in database.external section.
PostgreSQL 同样通过 Helm Charts 来完成在 Kubernetes 集群中的高可用部署。这里还需要注意的是,选择 internal 模式的数据库,在初始化阶段会执行几个 SQL 脚本来创建 Harbor 使用到的一些库表,因此如果连接 external 的数据库,这个初始化需要自行完成,否则就会出现 Harbor 组件无法正常连接到数据库的报错。
部署
 1
 2
 3
 4
 5
 6
 7
 8
 9
10
|
helm repo add bitnami https://charts.bitnami.com/bitnami
helm pull bitnami/postgresql
helm install my-release bitnami/postgresql

helm install my-release my-repo/postgresql-ha --set metrics.enabled=true --set metrics.serviceMonitor.enabled=true
helm uninstall my-release

export POSTGRES_PASSWORD=$(kubectl get secret --namespace pgsql my-release-postgresql-ha-postgresql -o jsonpath="{.data.postgresql-password}" | base64 -d)
kubectl run my-release-postgresql-ha-client --rm --tty -i --restart='Never' --namespace pgsql --image docker.io/bitnami/postgresql-repmgr:14.5.0-debian-11-r19 --env="PGPASSWORD=$POSTGRES_PASSWORD"  \
        --command -- psql -h my-release-postgresql-ha-pgpool -p 5432 -U postgres -d postgres
|
 1
 2
 3
 4
 5
 6
 7
 8
 9
10
11
12
13
14
15
16
17
18
19
20
21
22
23
24
25
26
27
28
29
30
31
32
33
34
35
|
# helm install my-release my-repo/postgresql-ha
NAME: my-release
LAST DEPLOYED: Tue Oct 11 18:01:22 2022
NAMESPACE: pgsql
STATUS: deployed
REVISION: 1
TEST SUITE: None
NOTES:
CHART NAME: postgresql-ha
CHART VERSION: 9.4.6
APP VERSION: 14.5.0
** Please be patient while the chart is being deployed **
PostgreSQL can be accessed through Pgpool via port 5432 on the following DNS name from within your cluster:

    my-release-postgresql-ha-pgpool.pgsql.svc.cluster.local

Pgpool acts as a load balancer for PostgreSQL and forward read/write connections to the primary node while read-only connections are forwarded to standby nodes.

To get the password for "postgres" run:

    export POSTGRES_PASSWORD=$(kubectl get secret --namespace pgsql my-release-postgresql-ha-postgresql -o jsonpath="{.data.postgresql-password}" | base64 -d)

To get the password for "repmgr" run:

    export REPMGR_PASSWORD=$(kubectl get secret --namespace pgsql my-release-postgresql-ha-postgresql -o jsonpath="{.data.repmgr-password}" | base64 -d)

To connect to your database run the following command:

    kubectl run my-release-postgresql-ha-client --rm --tty -i --restart='Never' --namespace pgsql --image docker.io/bitnami/postgresql-repmgr:14.5.0-debian-11-r19 --env="PGPASSWORD=$POSTGRES_PASSWORD"  \
        --command -- psql -h my-release-postgresql-ha-pgpool -p 5432 -U postgres -d postgres

To connect to your database from outside the cluster execute the following commands:

    kubectl port-forward --namespace pgsql svc/my-release-postgresql-ha-pgpool 5432:5432 &
    psql -h 127.0.0.1 -p 5432 -U postgres -d postgres
|
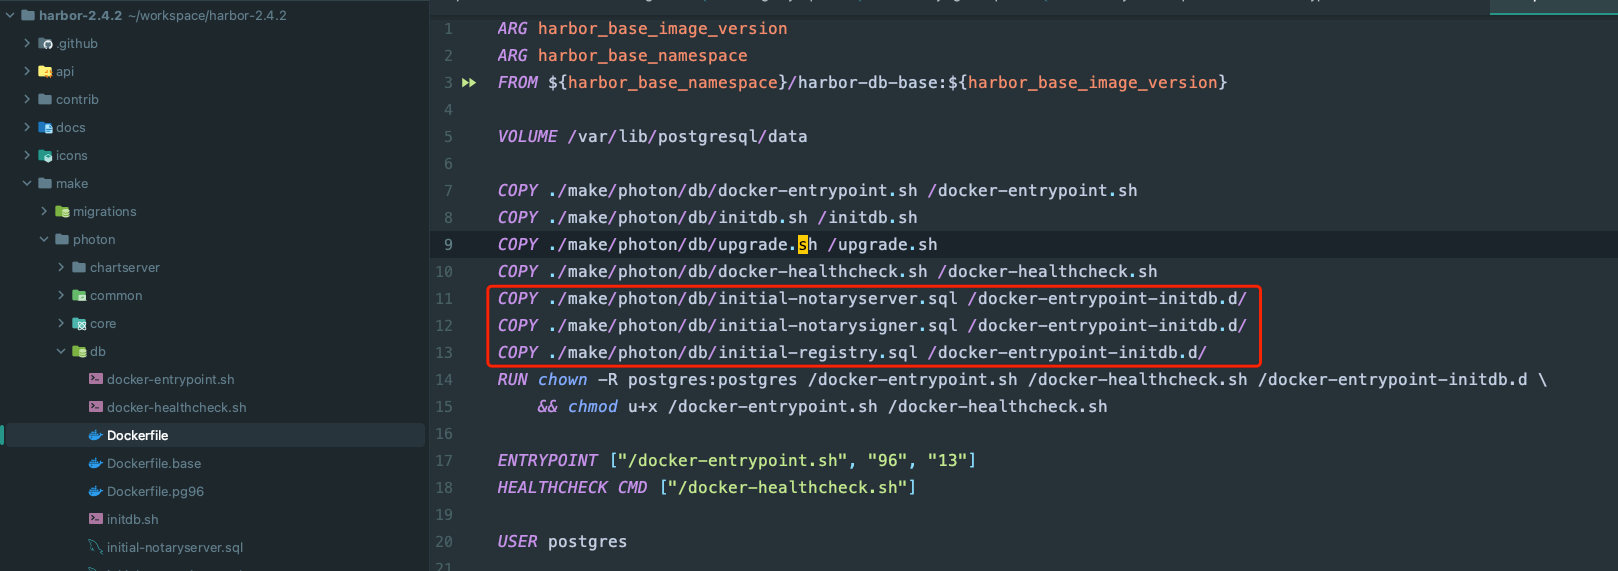
初始化数据库,从 internal 的 Harbor db 的镜像来看,数据库的初始化主要是执行了下面三个脚本,也就是三条创建数据库的 sql。

 1
 2
 3
 4
 5
 6
 7
 8
 9
10
11
12
13
14
15
16
17
|
# registry
CREATE DATABASE registry ENCODING 'UTF8';
\c registry;

CREATE TABLE schema_migrations(version bigint not null primary key, dirty boolean not null);

# notarysigner
CREATE DATABASE notarysigner;
CREATE USER signer;
alter user signer with encrypted password 'password';
GRANT ALL PRIVILEGES ON DATABASE notarysigner TO signer;

# notaryserver
CREATE DATABASE notaryserver;
CREATE USER server;
alter user server with encrypted password 'password';
GRANT ALL PRIVILEGES ON DATABASE notaryserver TO server;
|
测试
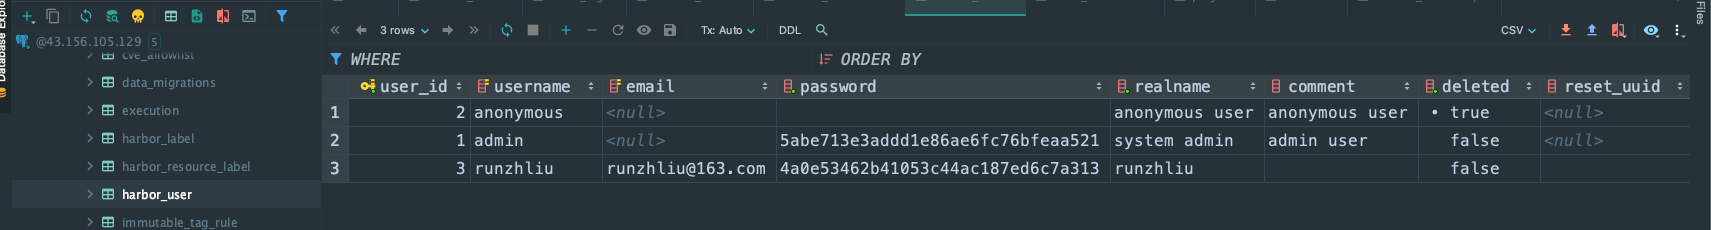
通过 DataGrip 来连接 PostgreSQL,查看 registry 下的各种表。
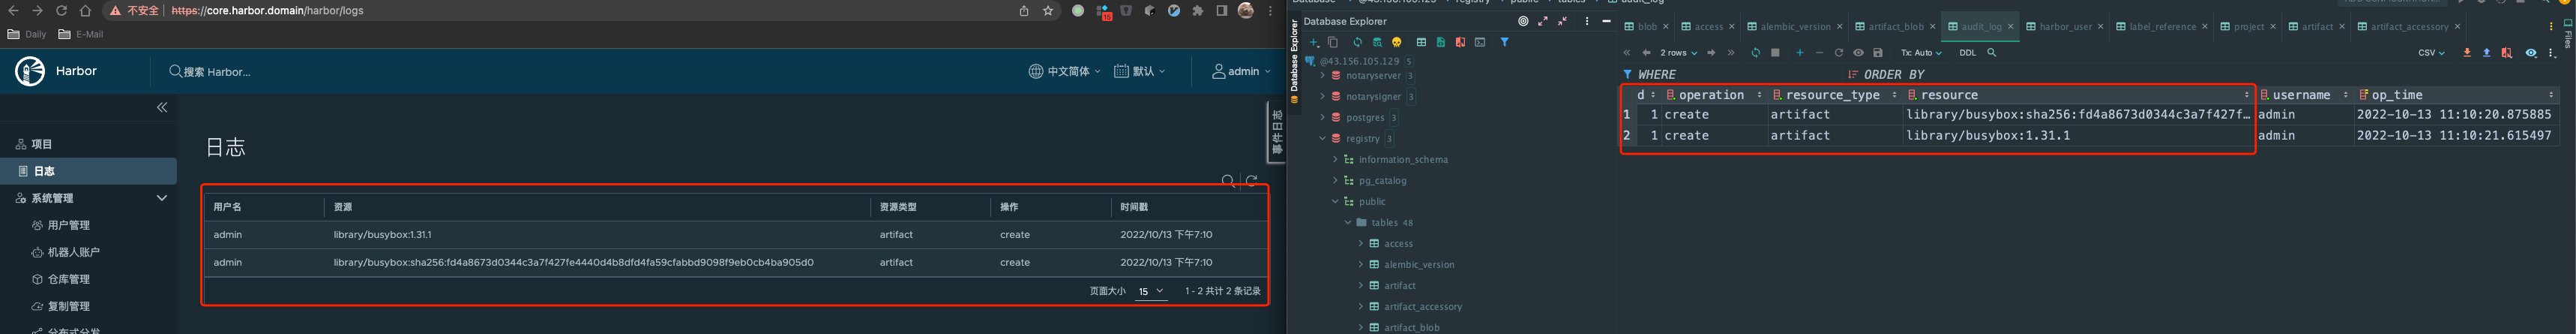
audit表中刚好能对应日志记录
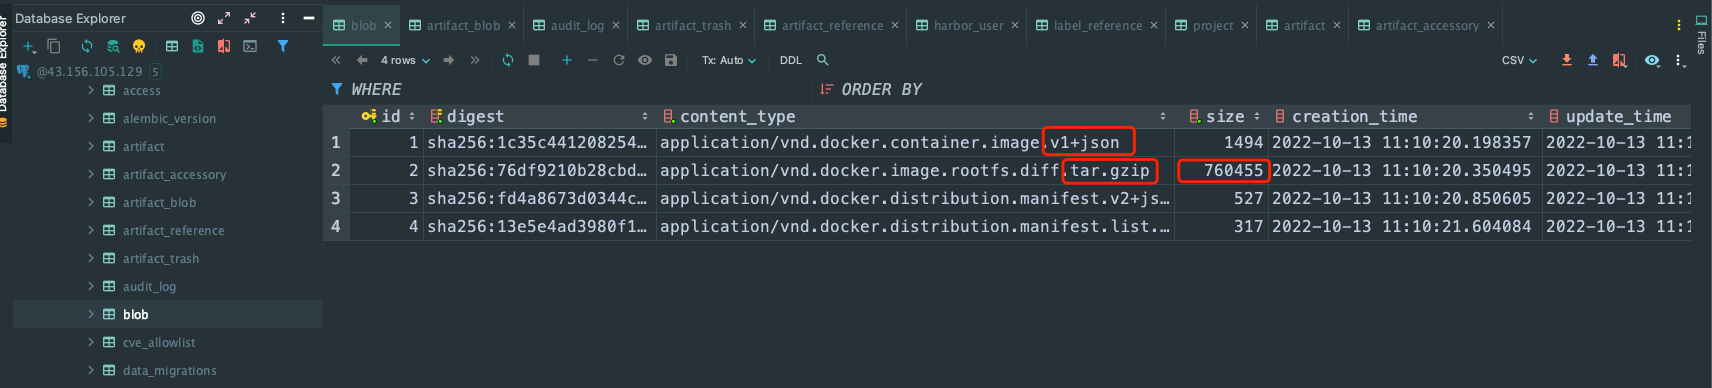
查看blob表
如果熟悉镜像分层原来的同学,应该知道这里的json文件是镜像的描述文件,真正的镜像文件系统是tar.gz格式的,因此体积也更大
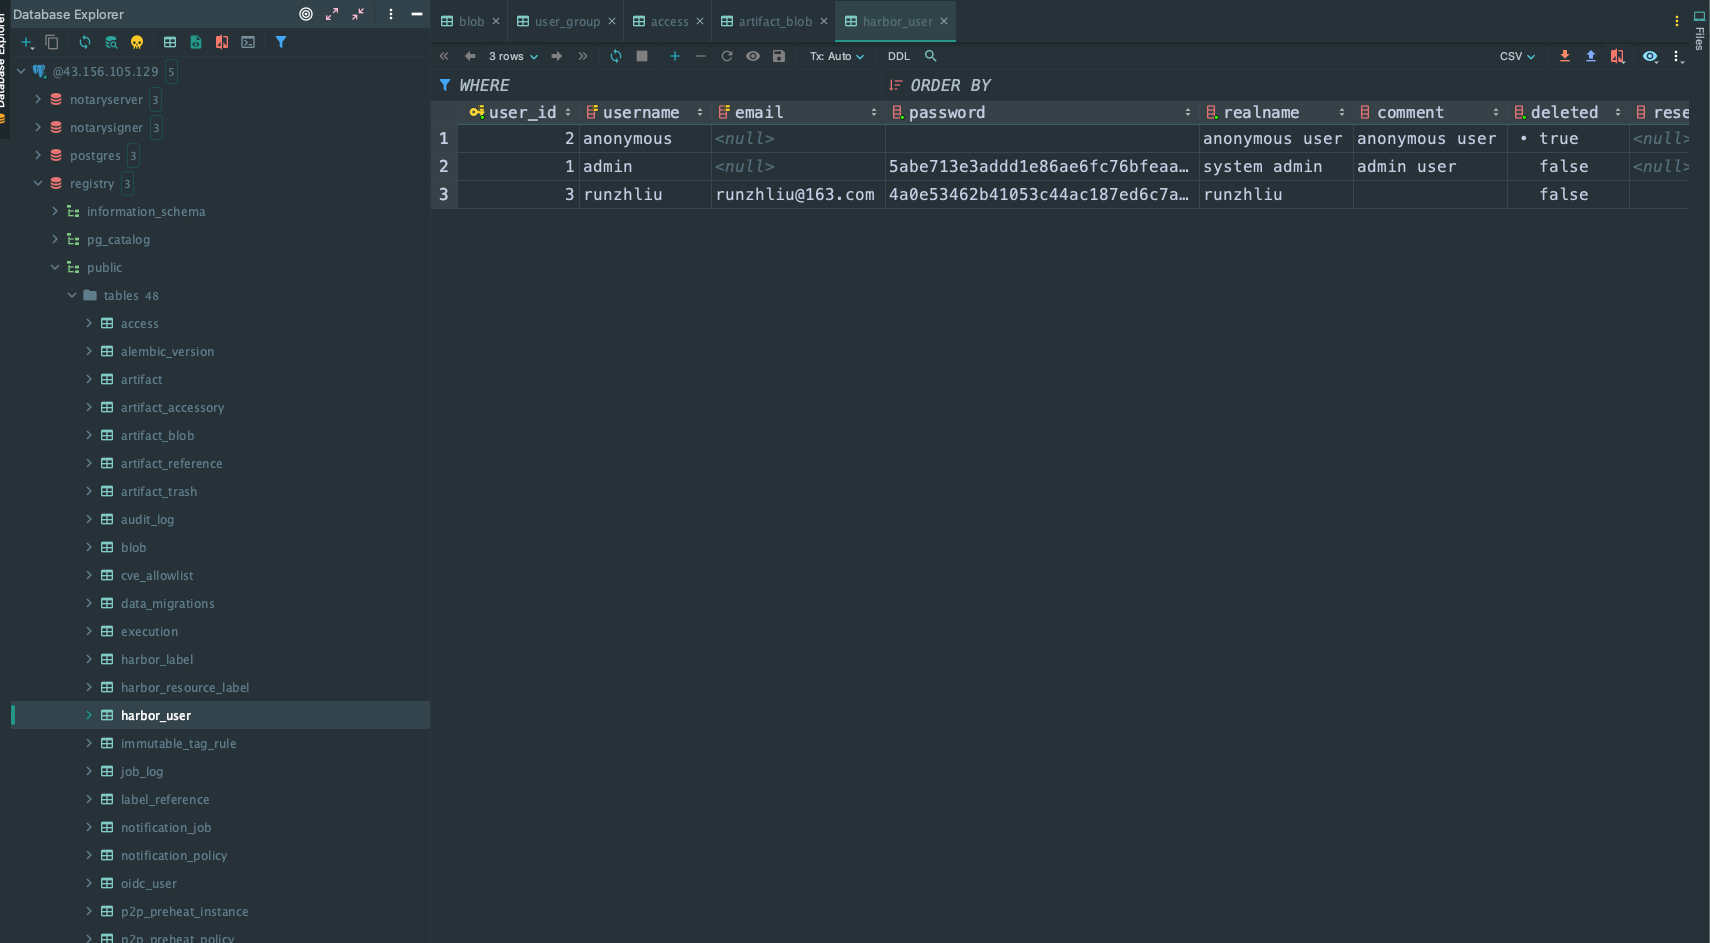
Harbor用户表
Redis高可用
External Redis Set the redis.type to external and fill the information in redis.external section. Harbor introduced redis Sentinel mode support in 2.1.0. You can enable this by setting sentinel_master_set and host to <host_sentinel1>:<port_sentinel1>,<host_sentinel2>:<port_sentinel2>,<host_sentinel3>:<port_sentinel3>.
Redis 同样通过 Helm Charts 来完成在 Kubernetes 集群中的高可用部署。
部署
1
2
3
4
|
helm repo add my-repo https://charts.bitnami.com/bitnami
helm pull my-repo/redis
# 目前需要关掉sentiel的密码
helm install my-release my-repo/redis --set architecture=replication --set sentinel.enabled=true --set auth.enabled=false --set metrics.enabled=true --set metrics.serviceMonitor.enabled=true
|
通过 Helm 部署 Redis 之后,需要注意一下输出的内容,可以帮助我们更好的对部署出来的 Redis 进行测试。
 1
 2
 3
 4
 5
 6
 7
 8
 9
10
11
12
13
14
15
16
17
18
19
20
21
22
23
24
25
26
27
28
29
30
31
32
33
34
35
36
37
38
39
40
41
42
43
44
|
# helm install my-release my-repo/redis --set architecture=replication --set sentinel.enabled=true --set auth.enabled=false --set metrics.enabled=true --set metrics.serviceMonitor.enabled=true

NAME: my-release
LAST DEPLOYED: Tue Oct 11 14:00:47 2022
NAMESPACE: redis
STATUS: deployed
REVISION: 1
TEST SUITE: None
NOTES:
CHART NAME: redis
CHART VERSION: 17.3.4
APP VERSION: 7.0.5

** Please be patient while the chart is being deployed **

Redis® can be accessed via port 6379 on the following DNS name from within your cluster:

    my-release-redis.redis.svc.cluster.local for read only operations

For read/write operations, first access the Redis® Sentinel cluster, which is available in port 26379 using the same domain name above.

To get your password run:

    export REDIS_PASSWORD=$(kubectl get secret --namespace redis my-release-redis -o jsonpath="{.data.redis-password}" | base64 -d)

To connect to your Redis® server:

1. Run a Redis® pod that you can use as a client:

   kubectl run --namespace redis redis-client --restart='Never'  --env REDIS_PASSWORD=$REDIS_PASSWORD  --image docker.io/bitnami/redis:7.0.5-debian-11-r7 --command -- sleep infinity

   Use the following command to attach to the pod:

   kubectl exec --tty -i redis-client \
   --namespace redis -- bash

2. Connect using the Redis® CLI:
   REDISCLI_AUTH="$REDIS_PASSWORD" redis-cli -h my-release-redis -p 6379 # Read only operations
   REDISCLI_AUTH="$REDIS_PASSWORD" redis-cli -h my-release-redis -p 26379 # Sentinel access

To connect to your database from outside the cluster execute the following commands:

    kubectl port-forward --namespace redis svc/my-release-redis 6379:6379 &
    REDISCLI_AUTH="$REDIS_PASSWORD" redis-cli -h 127.0.0.1 -p 6379
|
测试
按照部署成功的返回命令,通过命令创建 Redis Client 的 Pod,然后通过 redis-cli 登录 Redis。
1
2
3
4
5
6
|
# 部署客户端
kubectl run --namespace redis redis-client --restart='Never' --env REDIS_PASSWORD=$REDIS_PASSWORD --image docker.io/bitnami/redis:7.0.5-debian-11-r7 --command -- sleep infinity
# 进入客户端操作
kubectl exec --tty -i redis-client --namespace redis -- bash
# 登录客户端
REDISCLI_AUTH="$REDIS_PASSWORD" redis-cli -h my-release-redis -p 26379 # Sentinel access
|
数据库监控
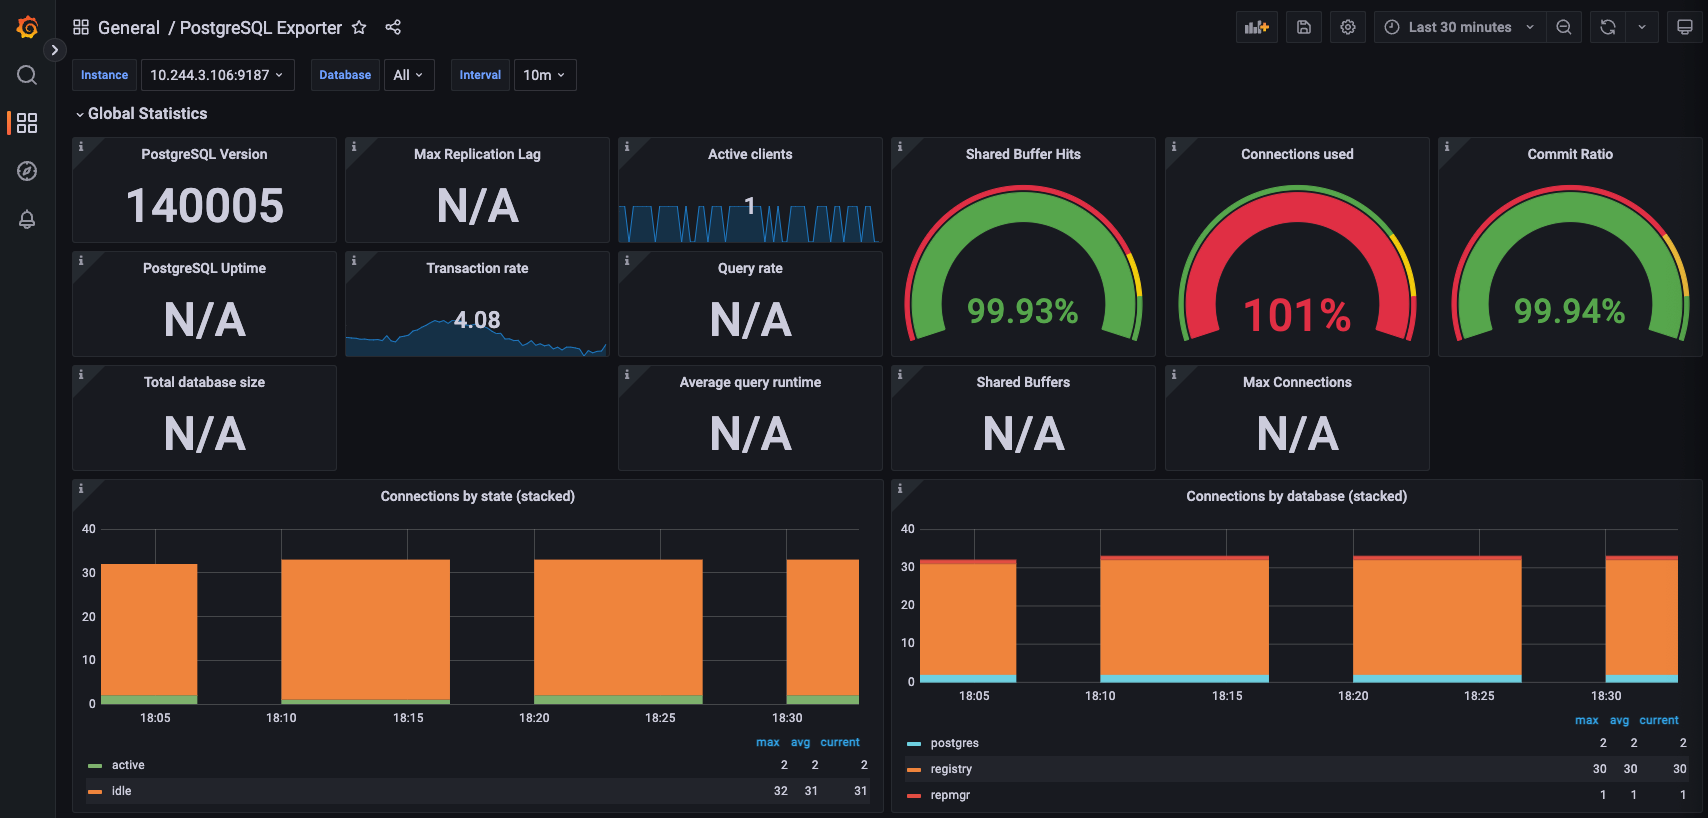
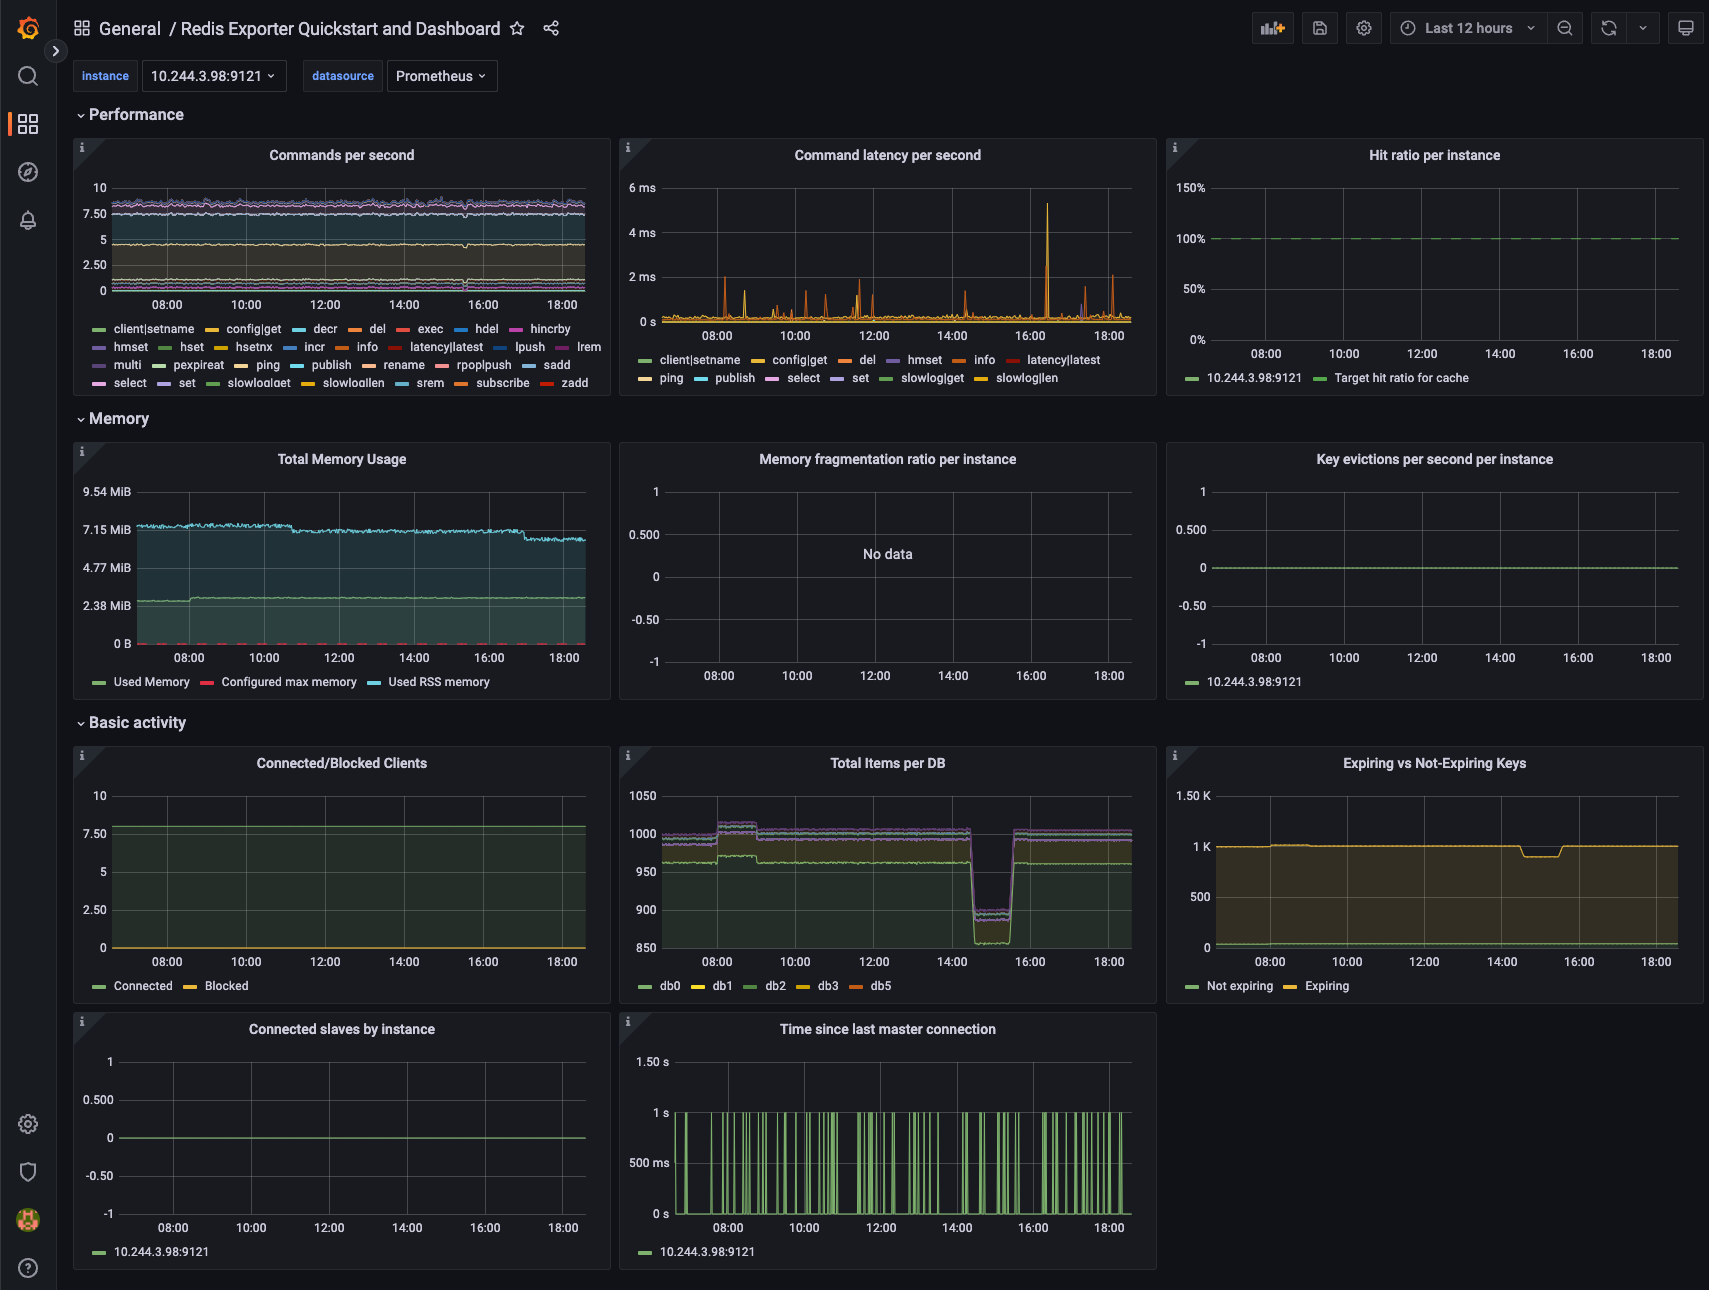
选择 external 模式的数据库,因为数据库都是通过 Harbor 以外的 Helm Charts 来部署的,因此这些数据库的监控,就还是从这些数据库的 Helm Charts 来部署和配置,通过开启对应的 metrics 字段就可以。PostgreSQL 和 Redis 的 Helm Charts 里关于 metrics 的逻辑都是引入一个 Exporter 的 SideCar 容器,因此可以从 Grafana 的官网找到一下两个 Dashboard 来展示 PostgreSQL 和 Redis 的监控状态。
https://grafana.com/grafana/dashboards/12485-postgresql-exporter/
https://grafana.com/grafana/dashboards/14091-redis-dashboard-for-prometheus-redis-exporter-1-x/
PostgreSQL 关于打开 metrics 的配置。
 1
 2
 3
 4
 5
 6
 7
 8
 9
10
|
# postgresql
metrics:
  ## Bitnami PostgreSQL Prometheus exporter image
  ## @param metrics.enabled Enable PostgreSQL Prometheus exporter
  ##
  enabled: false
  serviceMonitor:
    ## @param metrics.serviceMonitor.enabled if `true`, creates a Prometheus Operator ServiceMonitor (also requires `metrics.enabled` to be `true`)
    ##
    enabled: false
|
Redis 关于打开 metrics 的配置。
1
2
3
4
5
6
7
8
9
|
# redis
metrics:
  ## @param metrics.enabled Start a sidecar prometheus exporter to expose Redis® metrics
  ##
  enabled: false
  serviceMonitor:
    ## @param metrics.serviceMonitor.enabled Create ServiceMonitor resource(s) for scraping metrics using PrometheusOperator
    ##
    enabled: false
|
通过事件可以分析出来,PostgreSQL 和 Redis 的 Helm Charts 里关于 metrics 的逻辑都是引入一个 Exporter 的 SideCar 容器。
 1
 2
 3
 4
 5
 6
 7
 8
 9
10
11
12
13
14
15
16
17
18
19
20
21
22
23
24
25
26
27
28
29
|
--- PostgreSQL ---
Events:
  Type     Reason                  Age   From                     Message
  ----     ------                  ----  ----                     -------
  Normal   Scheduled               48s   default-scheduler        Successfully assigned pgql2/my-release-postgresql-ha-postgresql-0 to vm-1-102-centos
  Normal   SuccessfulAttachVolume  38s   attachdetach-controller  AttachVolume.Attach succeeded for volume "pvc-85fa3a7e-f3e3-4c4d-9ce0-910dcf406f84"
  Normal   Pulled                  31s   kubelet                  Container image "docker.io/bitnami/postgresql-repmgr:14.5.0-debian-11-r19" already present on machine
  Normal   Created                 31s   kubelet                  Created container postgresql
  Normal   Started                 31s   kubelet                  Started container postgresql
  Normal   Pulling                 31s   kubelet                  Pulling image "docker.io/bitnami/postgres-exporter:0.11.1-debian-11-r13"
  Normal   Pulled                  24s   kubelet                  Successfully pulled image "docker.io/bitnami/postgres-exporter:0.11.1-debian-11-r13" in 6.480529868s
  Normal   Created                 24s   kubelet                  Created container metrics
  Normal   Started                 24s   kubelet                  Started container metrics

--- Redis ---
Events:
  Type    Reason                  Age   From                     Message
  ----    ------                  ----  ----                     -------
  Normal  Scheduled               26s   default-scheduler        Successfully assigned redis/my-release-redis-node-0 to vm-1-102-centos
  Normal  SuccessfulAttachVolume  16s   attachdetach-controller  AttachVolume.Attach succeeded for volume "pvc-3f0062b2-b450-41c3-9756-9d3f6a2181c6"
  Normal  Pulled                  10s   kubelet                  Container image "docker.io/bitnami/redis:7.0.5-debian-11-r7" already present on machine
  Normal  Created                 10s   kubelet                  Created container redis
  Normal  Started                 10s   kubelet                  Started container redis
  Normal  Pulled                  10s   kubelet                  Container image "docker.io/bitnami/redis-sentinel:7.0.5-debian-11-r6" already present on machine
  Normal  Created                 10s   kubelet                  Created container sentinel
  Normal  Started                 10s   kubelet                  Started container sentinel
  Normal  Pulled                  10s   kubelet                  Container image "docker.io/bitnami/redis-exporter:1.44.0-debian-11-r16" already present on machine
  Normal  Created                 10s   kubelet                  Created container metrics
  Normal  Started                 10s   kubelet                  Started container metrics
|
注意修改postgresql-exporter的dashboard中的instance变量
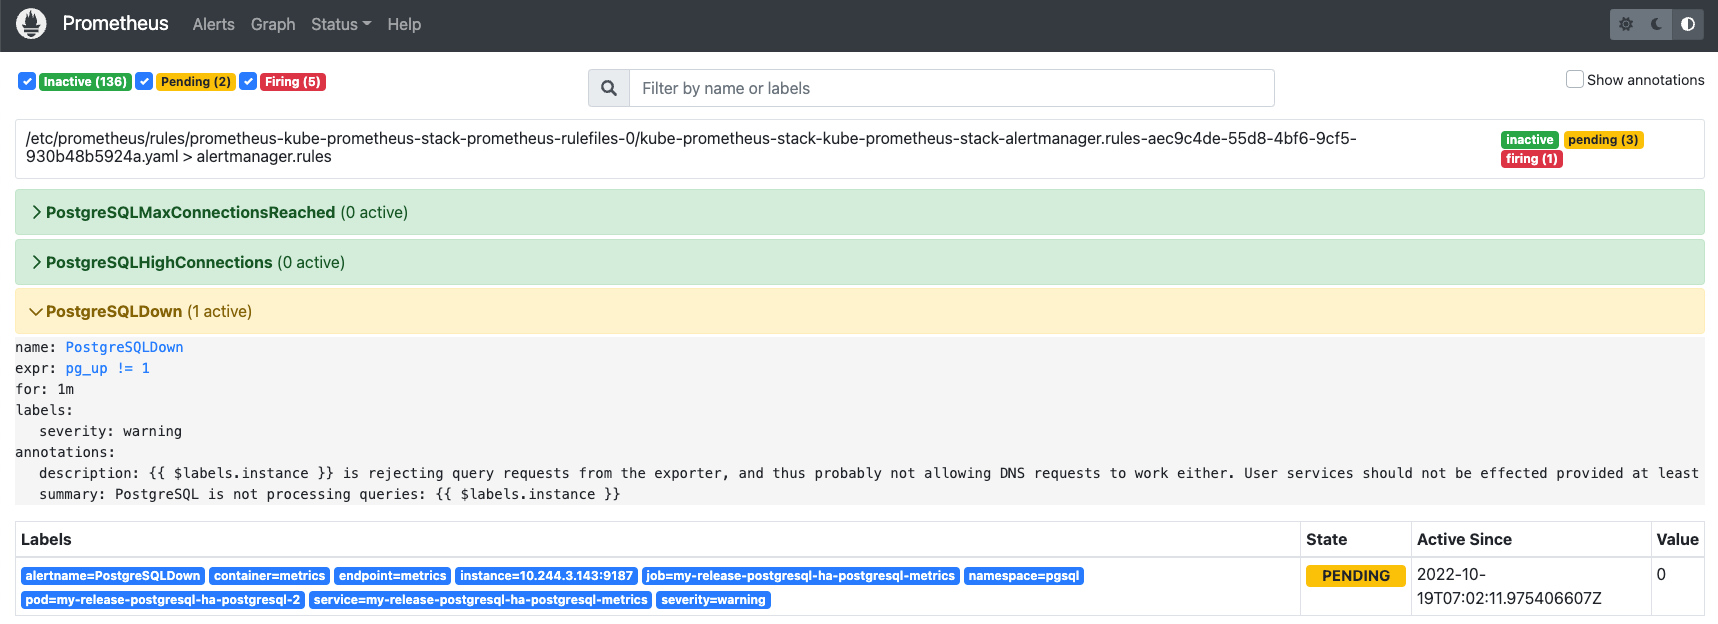
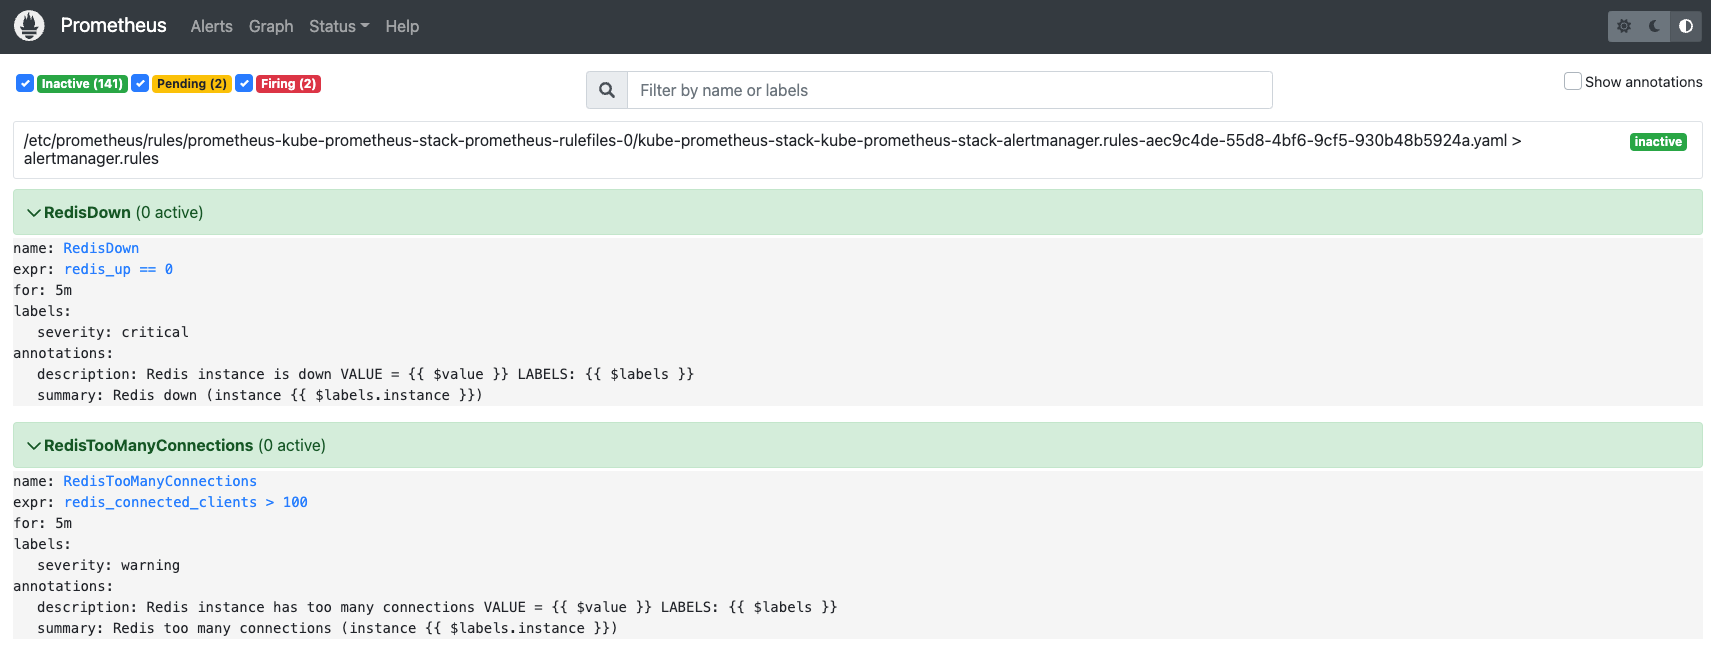
数据库告警
Harbor 官方是没有提供 Prometheus 的 Alert Rule 配置的,但是作为使用了 kube-prometheus-stack 全家桶的用户,还是希望统一一下告警的路径。下面是根据 Harbor 使用的数据库,日常运维的经验配置的一些告警的规则,供读者参考。
 1
 2
 3
 4
 5
 6
 7
 8
 9
10
11
12
13
14
15
16
17
18
19
20
21
22
23
24
25
26
27
28
29
30
31
32
33
34
35
36
37
38
39
40
41
42
43
44
45
46
47
48
49
50
51
52
53
54
55
56
57
58
59
60
61
62
63
64
65
66
67
68
69
70
71
72
73
74
75
76
77
78
79
80
81
82
83
84
85
86
87
88
89
90
91
|
# PostgreSQL
groups:
- name: PostgreSQL
  rules:
    - alert: PostgreSQLMaxConnectionsReached
      annotations:
        description: "{{ $labels.instance }} is exceeding the currently configured maximum Postgres connection limit (current value: {{ $value }}s). Services may be degraded - please take immediate action (you probably need to increase max_connections in the Docker image and re-deploy."
        summary: "{{ $labels.instance }} has maxed out Postgres connections."
      expr: |
        sum by (instance) (pg_stat_activity_count{})
        >=
        sum by (instance) (pg_settings_max_connections{})
        -
        sum by (instance) (pg_settings_superuser_reserved_connections{})
      for: 1m
      labels:
        severity: warning
    - alert: PostgreSQLHighConnections
      annotations:
        description: "{{ $labels.instance }} is exceeding 80% of the currently configured maximum Postgres connection limit (current value: {{ $value }}s). Please check utilization graphs and confirm if this is normal service growth, abuse or an otherwise temporary condition or if new resources need to be provisioned (or the limits increased, which is mostly likely)."
        summary: "{{ $labels.instance }} is over 80% of max Postgres connections."
      expr: |
        sum by (instance) (pg_stat_activity_count{})
        >
        (
          sum by (instance) (pg_settings_max_connections{})
          -
          sum by (instance) (pg_settings_superuser_reserved_connections{})
        ) * 0.8
      for: 10m
      labels:
        severity: warning
    - alert: PostgreSQLDown
      annotations:
        description: "{{ $labels.instance }} is rejecting query requests from the exporter, and thus probably not allowing DNS requests to work either. User services should not be effected provided at least 1 node is still alive."
        summary: "PostgreSQL is not processing queries: {{ $labels.instance }}"
      expr: pg_up{} != 1
      for: 1m
      labels:
        severity: warning
    - alert: PostgreSQLSlowQueries
      annotations:
        description: "PostgreSQL high number of slow queries {{ $labels.cluster }} for database {{ $labels.datname }} with a value of {{ $value }}."
        summary: "PostgreSQL high number of slow on {{ $labels.cluster }} for database {{ $labels.datname }}"
      expr: |
        avg by (datname) (
          rate (
            pg_stat_activity_max_tx_duration{datname!~"template.*",}[2m]
          )
        ) > 2 * 60
      for: 2m
      labels:
        severity: warning
    - alert: PostgreSQLQPS
      annotations:
        description: "PostgreSQL high number of queries per second on {{ $labels.cluster }} for database {{ $labels.datname }} with a value of {{ $value }}"
        summary: "PostgreSQL high number of queries per second {{ $labels.cluster }} for database {{ $labels.datname }}"
      expr: |
        avg by (datname) (
          irate(
            pg_stat_database_xact_commit{datname!~"template.*",}[5m]
          )
          +
          irate(
            pg_stat_database_xact_rollback{datname!~"template.*",}[5m]
          )
        ) > 10000
      for: 5m
      labels:
        severity: warning
    - alert: PostgreSQLCacheHitRatio
      annotations:
        description: "PostgreSQL low on cache hit rate on {{ $labels.cluster }} for database {{ $labels.datname }} with a value of {{ $value }}"
        summary: "PostgreSQL low cache hit rate on {{ $labels.cluster }} for database {{ $labels.datname }}"
      expr: |
        avg by (datname) (
          rate(pg_stat_database_blks_hit{datname!~"template.*",}[5m])
          /
          (
            rate(
              pg_stat_database_blks_hit{datname!~"template.*",}[5m]
            )
            +
            rate(
              pg_stat_database_blks_read{datname!~"template.*",}[5m]
            )
          )
        ) < 0.98
      for: 5m
      labels:
        severity: warning
|
 1
 2
 3
 4
 5
 6
 7
 8
 9
10
11
12
13
14
15
16
17
18
19
20
|
# Redis
groups:
  - name: redis
    rules:
    - alert: RedisDown
      annotations:
        description: "Redis instance is down VALUE = {{ $value }} LABELS: {{ $labels }}"
        summary: "Redis down (instance {{ $labels.instance }})"
      expr: redis_up == 0
      for: 1m
      labels:
        severity: critical
    - alert: RedisTooManyConnections
      annotations:
        description: "Redis instance has too many connections VALUE = {{ $value }} LABELS: {{ $labels }}"
        summary: "Redis too many connections (instance {{ $labels.instance }})"
      expr: redis_connected_clients > 100
      for: 2m
      labels:
        severity: warning
|
运维
当把 Harbor 需要使用的 PostgreSQL 以及 Redis 按照高可用的要求单独部署成 external 模式的时候,就意味着我们是需要对数据库做一些简单的运维的,无论你是不是专业的 DBA。将 PostgreSQL 部署在 Kubernetes 之后,其备份的方案有很多,包括克隆、备份 PVC,或者是否备份到原集群还是通过 S3 或者其他协议将备份文件上传到其他存储上。无论是选择哪种方式,本质上就是为了将这个备份文件放在一个安全的地方,既方便上传的,也要方便下载以快速重建数据库。
备份数据库
关于备份数据库,可以通过下面的脚本进行备份,如果需要做定期备份的,可以通过在 Kubernetes 集群创建一个 Cronjob 来做,可以参考 Simple backup of postgres database in kubernetes,整体来说,方法很多,选一种熟悉的即可。
1
2
3
4
5
6
7
8
|
# 通过环境变量注入数据库密码
export PGPASSWORD=
# 普通的备份
pg_dump -U postgres -h my-release-postgresql-ha-pgpool.pgsql.svc.cluster.local registry > registry.sql
# 备份成压缩文件
pg_dump -U postgres -h my-release-postgresql-ha-pgpool.pgsql.svc.cluster.local registry | gzip -9 > registry.sql.gz
# 解压上面这个文件
gzip -d registry.sql.gz
|
1
2
3
4
5
|
      - args:
          - -c
          - /opt/bitnami/scripts/start-scripts/start-node.sh
        command:
          - /bin/bash
|
恢复数据库
可以通过 drop 了原来的数据库,然后通过下面的恢复语句,测试一下备份的文件的有效性,注意一定要在测试环境中先测试了。
1
2
|
# 恢复数据库
psql -U postgres -h my-release-postgresql-ha-pgpool.pgsql.svc.cluster.local -f registry.sql
|
参考资料
- Deploying Harbor with High Availability via Helm
- PG高可用之主从流复制+keepalived的高可用
- 基于Patroni的PostgreSQL高可用环境部署
- Simple backup of postgres database in kubernetes
- How to backup and restore PostgreSQL on Kubernetes
- Postgresql备份与恢复数据库
- 如何在pg_dump时传入密码
- postgres-alerts
警告
本文最后更新于 2022年2月26日,文中内容可能已过时,请谨慎参考。