概述
通过 Kubernetes 的方式部署 kube-prometheus-stack,一次性可以安装好包括 Node Exporter,Grafana,Prometheus,AlertManager 等组件,整套下来实在太麻烦了,因为不希望为了部署一个 Prometheus 而准备部署一个 Kubernetes 集群,因此个人还是考虑在绿联 NAS 上部署 Prometheus。
创建容器
可以按照下面的方式创建容器。

Prometheus 的容器最核心还是 Prometheus 采集到的指标需要放在 NAS 上,这样就不会有单台机器的存储压力了,毕竟 NAS 都是 TB 级别的容量。
 1
 2
 3
 4
 5
 6
 7
 8
 9
10
11
12
13
14
15
16
17
|
docker run -d \
  --name prometheus \
  --user root \
  --restart always \
  -p 9090:9090 \
  -v /mnt/k8s/docker/images/prometheus/prometheus/config/prometheus.yml:/etc/prometheus/prometheus.yml \
  -v /mnt/k8s/docker/images/prometheus/prometheus/data:/prometheus \
  prom/prometheus:v2.32.1

docker run -d \
 --name prometheus \
 --restart always \
 --user root \
 -p 9090:9090 \
 -v /mnt/prometheus/prometheus/config/prometheus.yml:/etc/prometheus/prometheus.yml \
 -v /mnt/prometheus/prometheus/data:/prometheus \
 prom/prometheus:v2.32.1
|
1
2
3
4
5
6
|
mkdir /mnt/prometheus
bindfs \
  --perms=755 \
  --user=65534 \
  --group=65534 \
  /mnt/k8s/docker/images/prometheus/prometheus /mnt/prometheus
|
1
2
3
4
|
# 测试脚本
docker run --rm -it --entrypoint=sh \
  -v /mnt/k8s/docker/images/prometheus/prometheus:/prometheus \
  prom/prometheus:v2.32.1
|
访问Prometheus
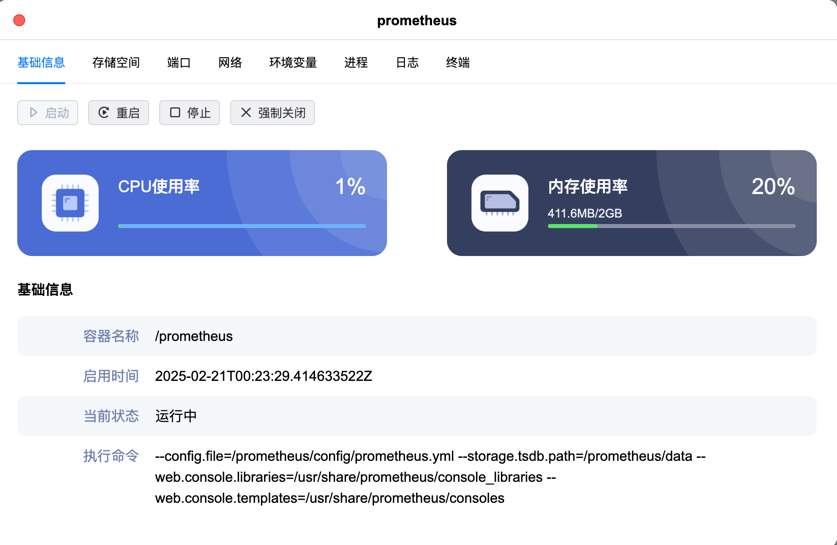
下面是通过绿联 NAS 的 Docker 管理平台创建成功的 Prometheus 服务。
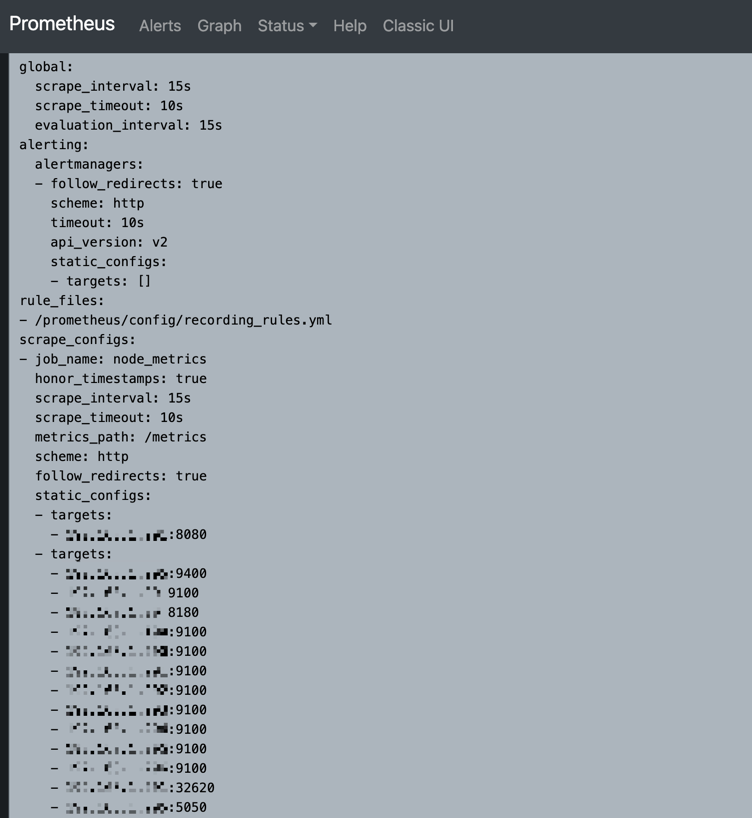
然后就是 Prometheus 的配置文件,主要是要部署相关指标的 exporter,然后才能在配置文件中按照不同的 job 分类配置。
警告
本文最后更新于 2025年2月3日,文中内容可能已过时,请谨慎参考。