给绿联NAS部署cadvisor
目录
概述
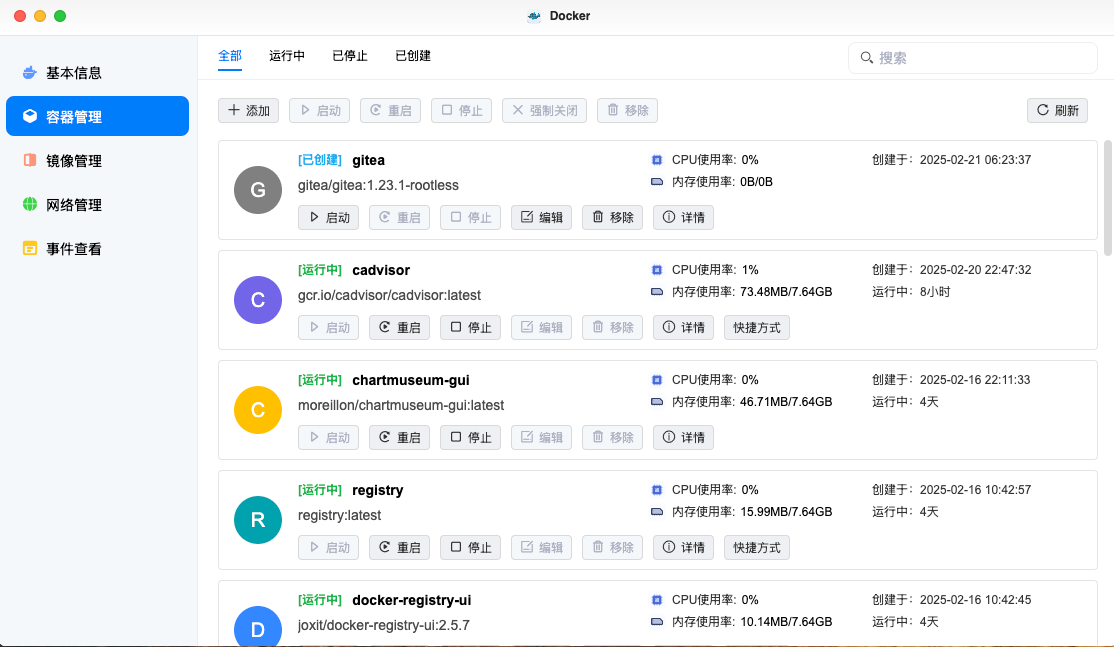
现在很多 NAS 厂家产品里都会引入 Docker,因此用 Docker 来部署各种服务就变成了 NAS 的可玩性的一部分了。虽说 NAS 开始做 Docker 服务了,但是很多 NAS 在做这个 Docker 的应用服务的时候做的还是不够好用,例如监控就做的一般了,如下的 Docker 应用中,仅有这些指标还是太少了。
部署cadvisor
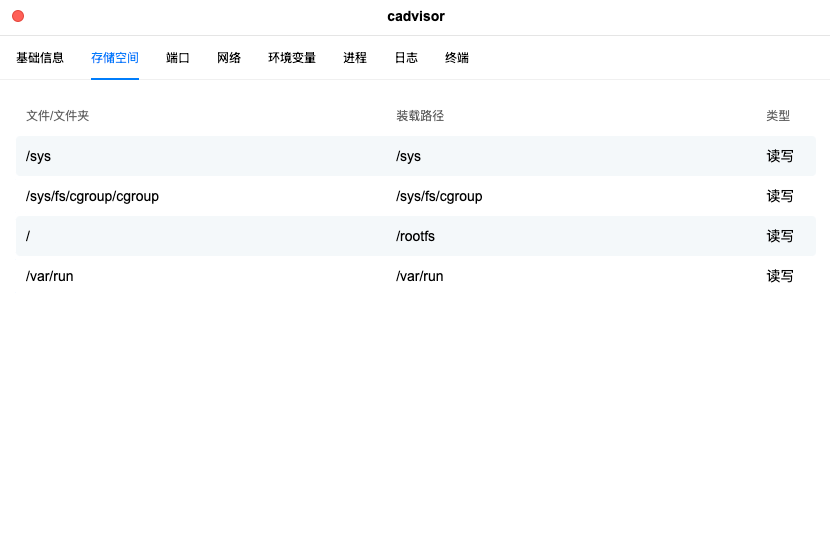
做容器方向的工程师都知道 cadvisor 是我们用来采集容器指标的核心工具,那么只要我们完成 cadvisor/prometheus/grafana 的部署,就可以轻松监控各种容器的运行状态了。然而大部分的厂家提供的 Docker 应用定制化太多了,对于 cadvisor 这种 类型的容器,在应用界面上估计是很难部署的,如下,部署 cadvisor 容器需要挂载宿主机上指定的目录,这在界面上是无法选择需要的系统路径的,大部分 NAS 的 Docker 应用在创建容器的时候,文件文件夹是不支持填写的,只能打开 NAS 用户下的文件夹。
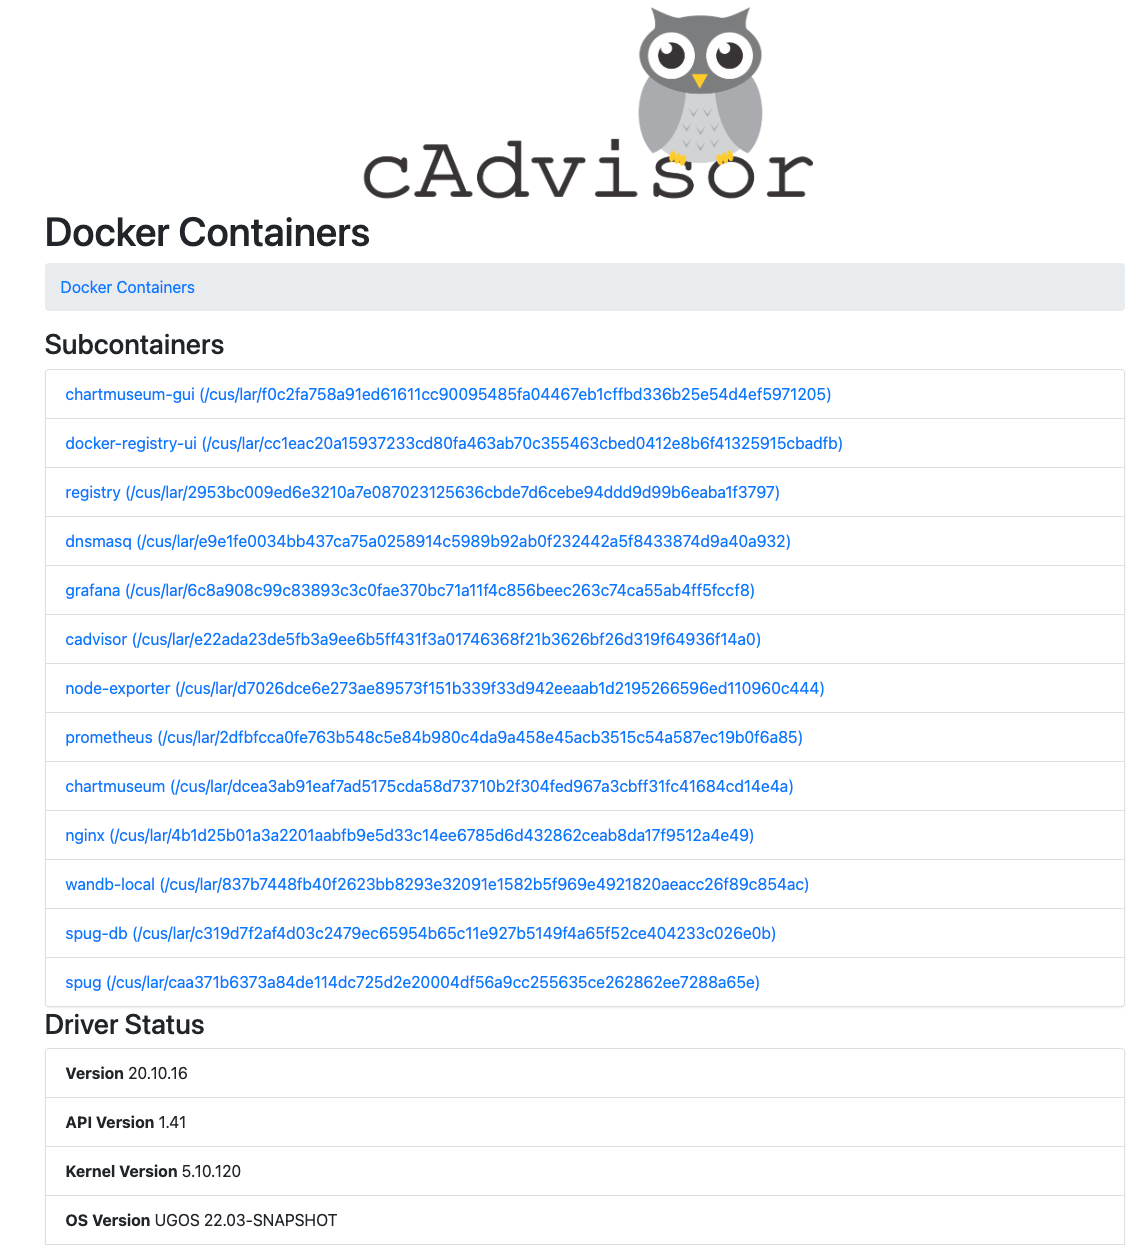
所以上图是怎么来的呢,这就只能通过 NAS 提供的登录 NAS 主机,手动执行 docker 命令才可以做到,大家可以按照下面的命令来运行 cadvisor。
|
|
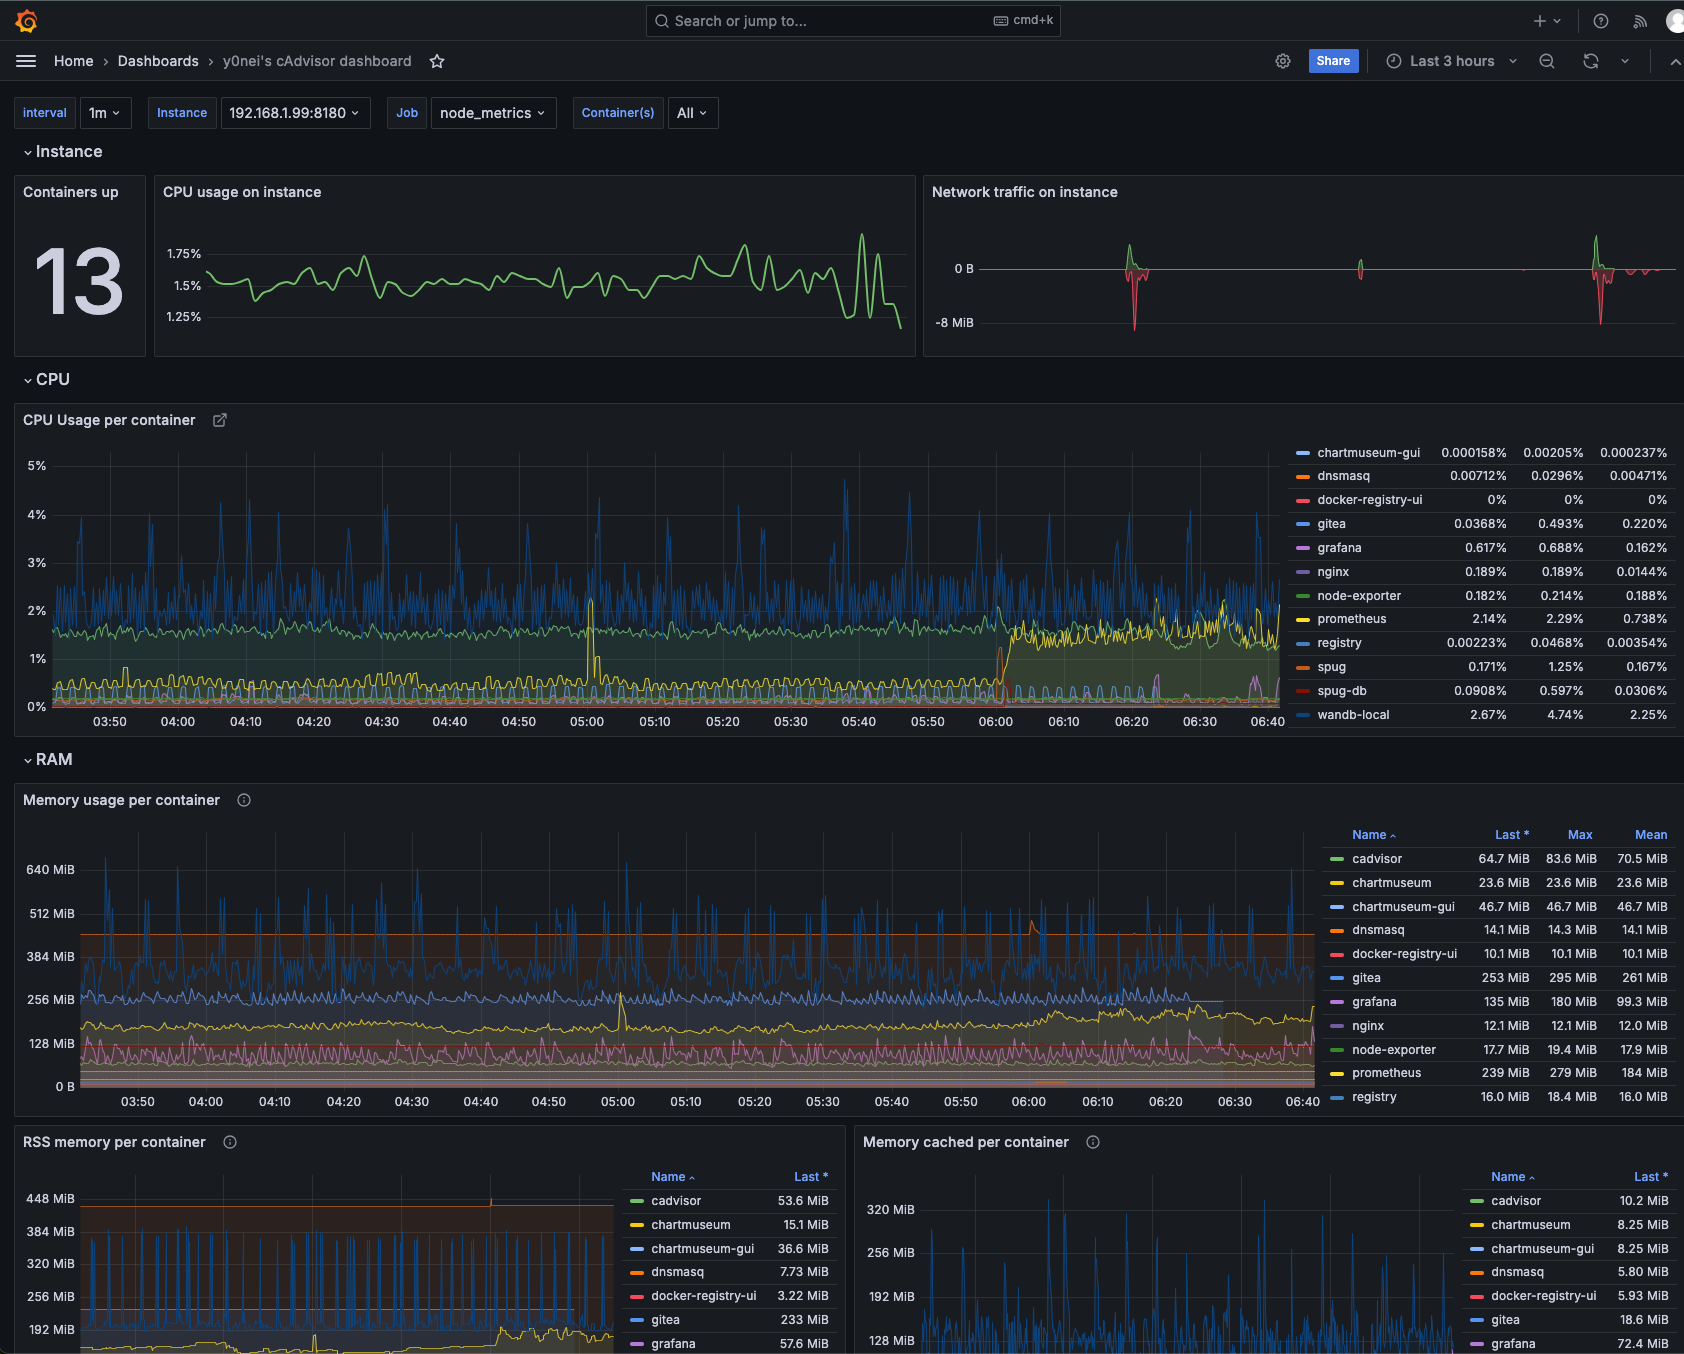
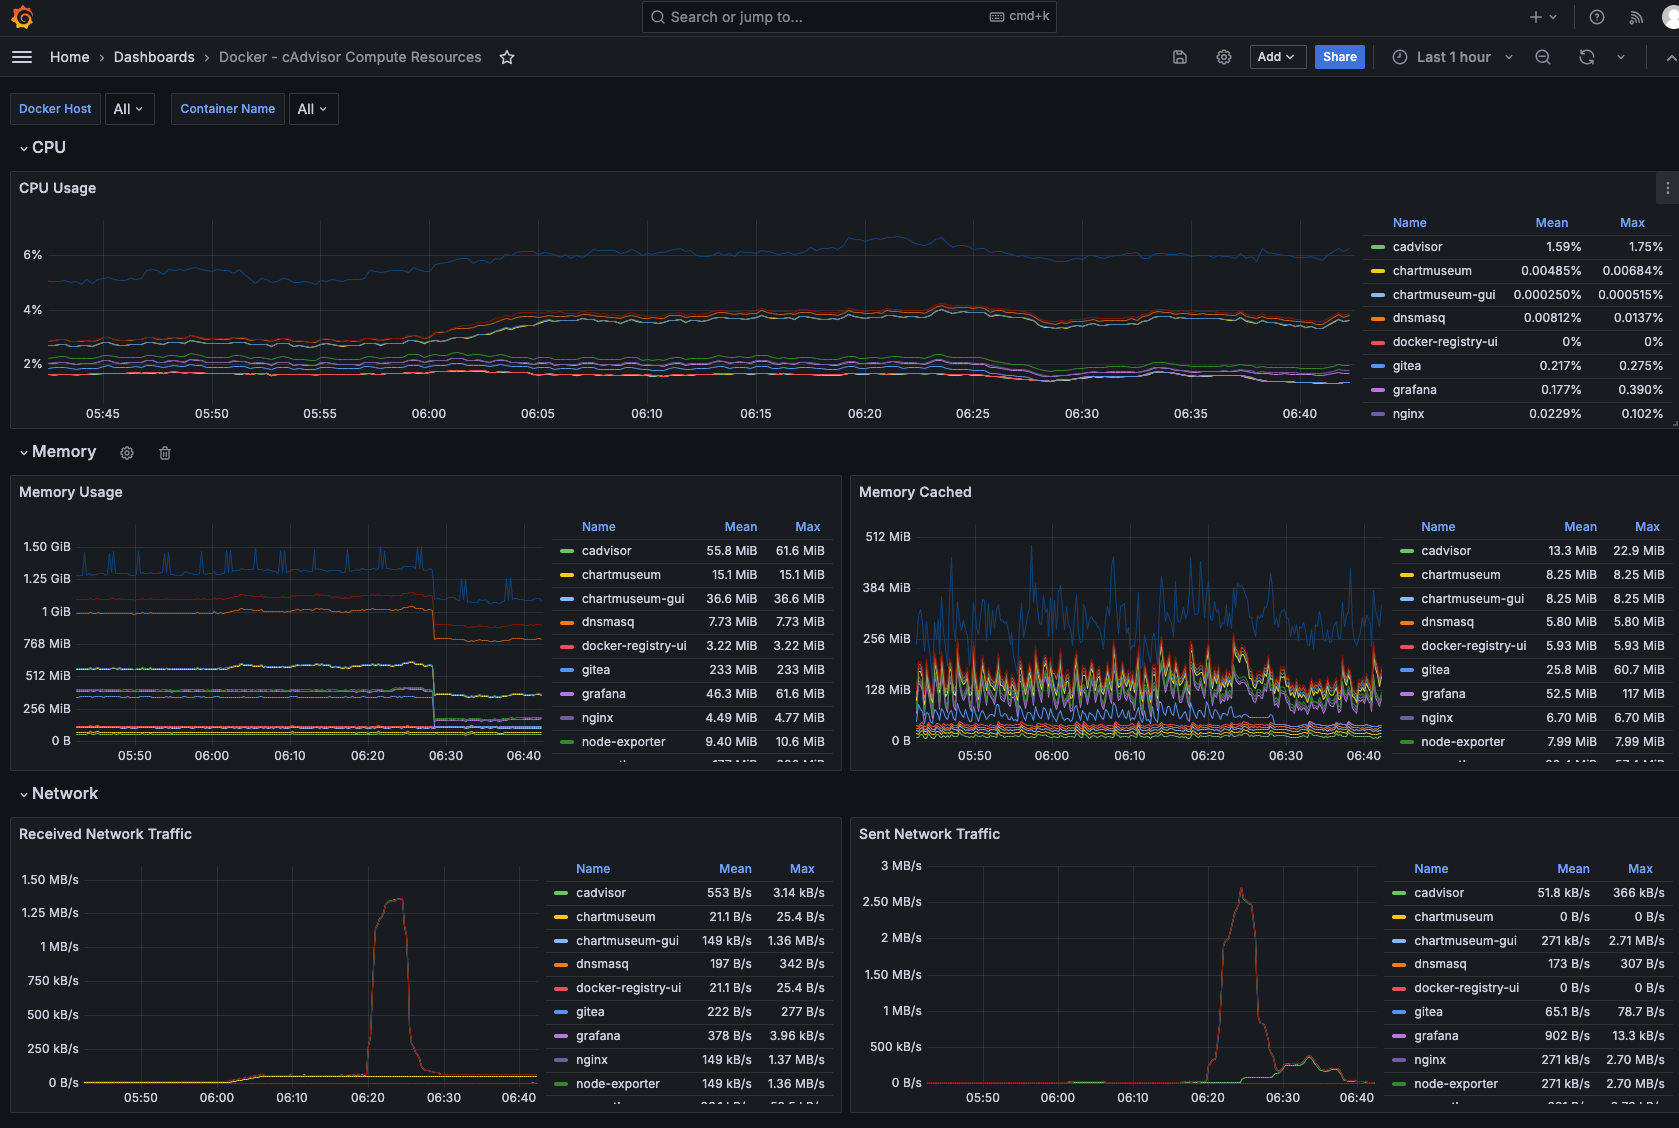
从下图可以看到,此时 NAS 上也部署了 prometheus 和 grafana 了,具体方法本文就不赘述了,部署完毕后,通过修改 prometheus 的配置文件,采集 cadvisor 的数据,然后我们找个合适的 dashboard 做指标的展示。
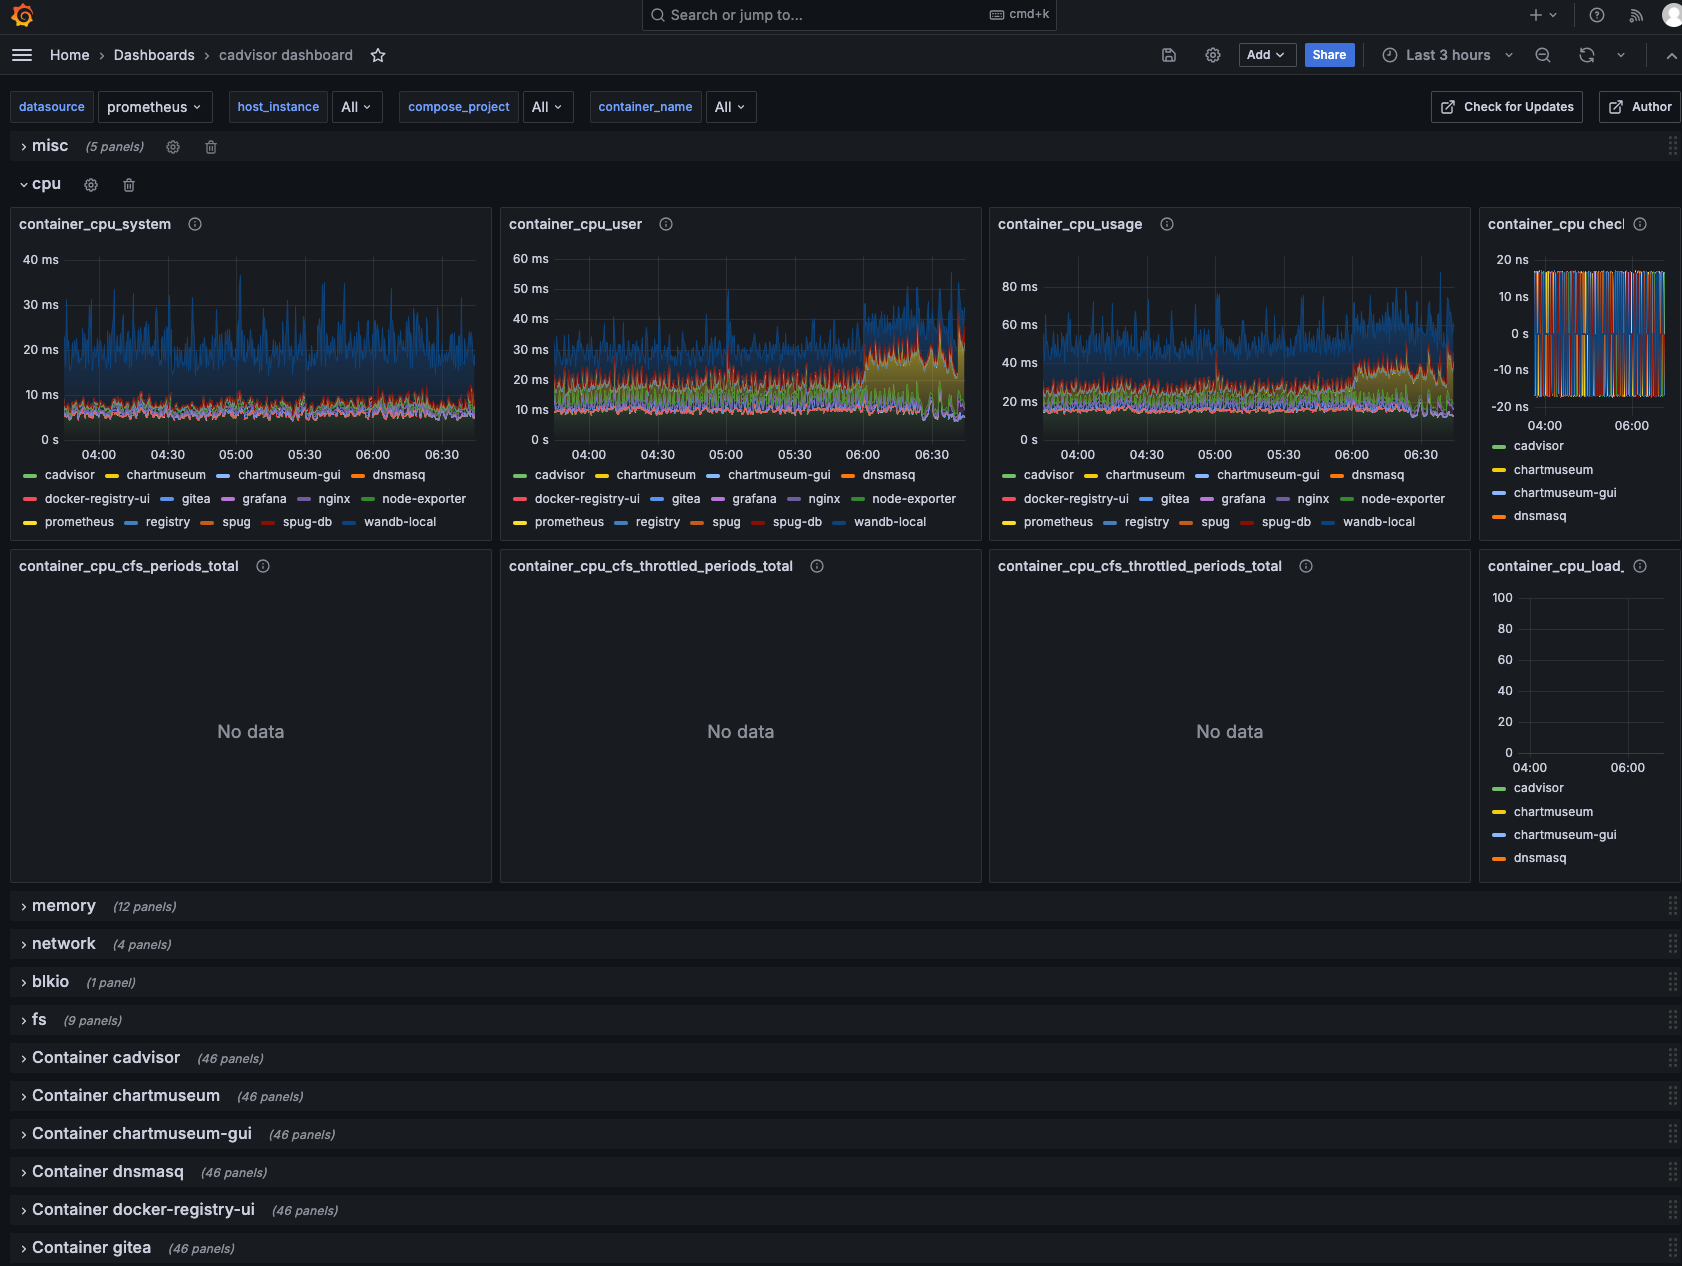
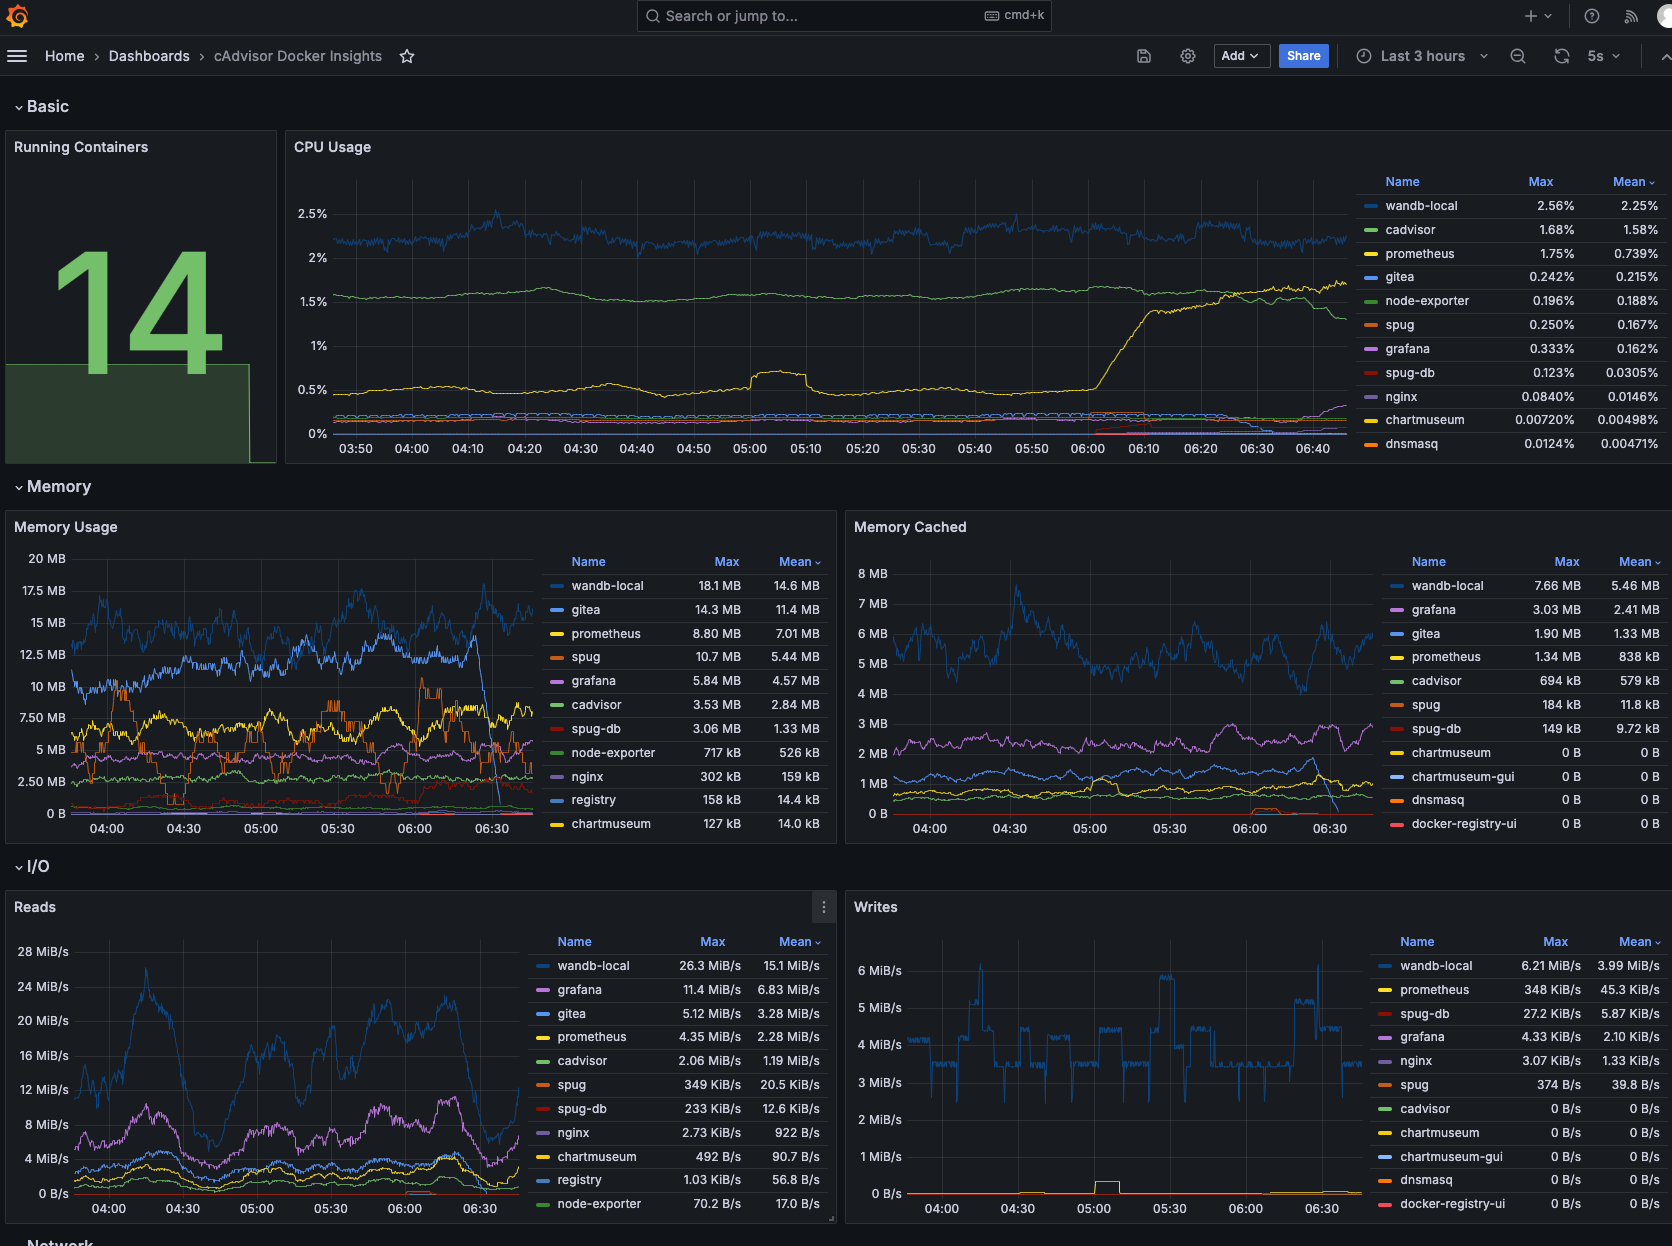
grafana 社区关于 cadvisor 的 dashboard 有不少,不过还在更新比较活跃的,我推荐下面这几个。
警告
本文最后更新于 2025年2月1日,文中内容可能已过时,请谨慎参考。